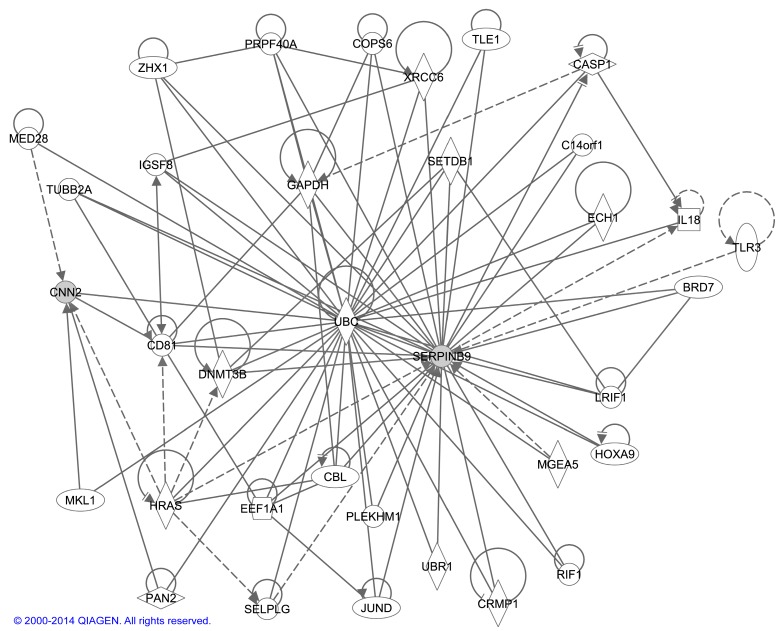
Figure 4.
Network of interactions between CNN2 and SERPINB9. Ingenuity Pathway Analysis® (Qiagen’s Ingenuity Systems, Redwood City, CA, USA) tool was used for the analysis. Molecules are represented as nodes, and the biological relationship between two nodes is represented as a line. Solid lines represent direct interactions and dashed lines indirect interactions. All lines are supported by at least one literature citation or from canonical information stored in the Ingenuity Pathways Knowledge Base (Qiagen’s Ingenuity Systems). Nodes are displayed using various shapes that represent the functional class of the gene product.

