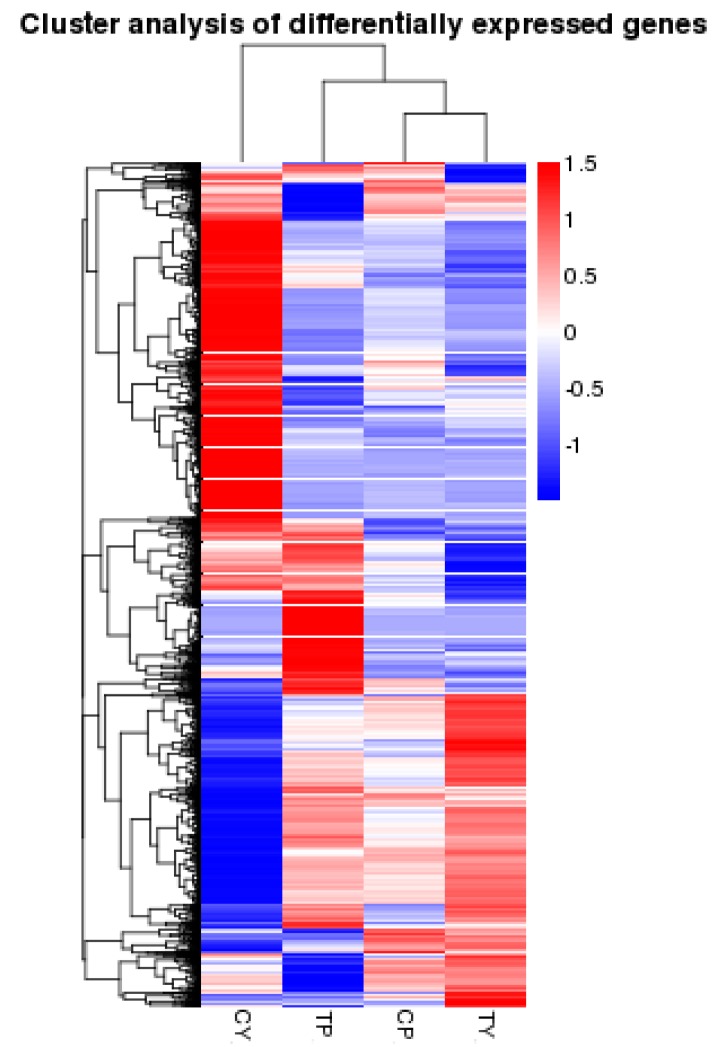
Figure 2.
Hierarchical cluster analysis of gene expression based on the log ratio fold change data. The color scale indicates the gene expression level: red color represents increased transcript abundance and blue color represents decreased transcript abundance. TP and CP indicate cold treated P64S and control treated P64S, respectively. TY and CY indicate cold treated Y58S and control treated Y58S, respectively.

