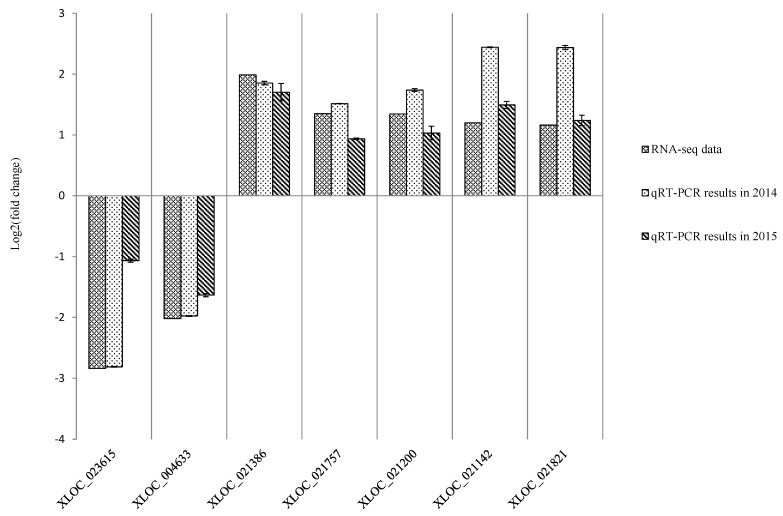
Figure 6.
Expression pattern validation of selected genes via qPCR. The expression profiles for seven selected genes were examined via qPCR. The Y-axis displays transcript fold changes (log2) and the bars of RNA-seq data indicate transcript abundance changes calculated by the FPKM method (Fragments Per Kilobase of exon per Million mapped reads). The bars with associated standard error bars represent relative expression levels as determined by qPCR using the 2−ΔΔCt method. Results represent a mean ± SD of three biological replicates.

