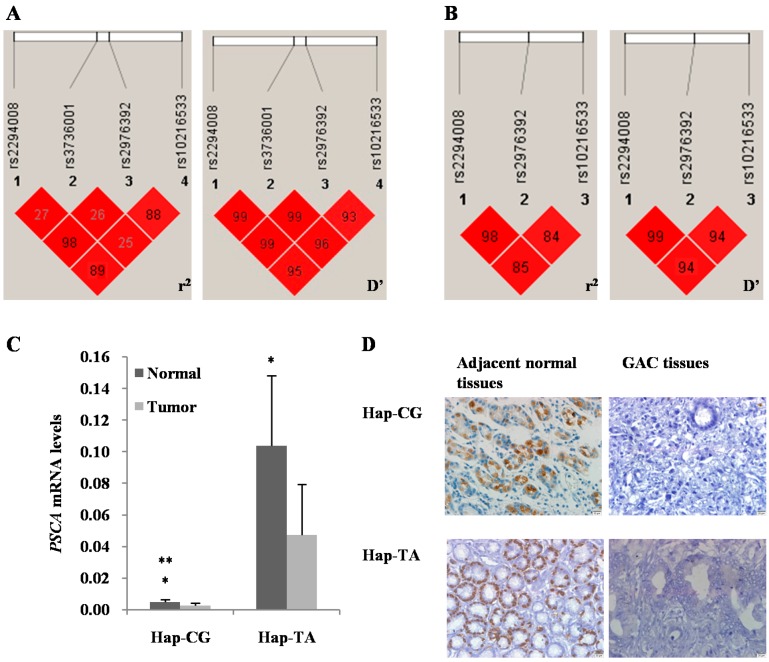
Figure 1.
Linkage disequilibrium (LD) and PSCA expression analysis. (A) LD of four SNPs in PSCA gene (rs2294008, rs3736001, rs2976392 and rs10216533); (B) LD of three SNPs in PSCA gene (rs2294008, rs2976392 and rs10216533). Values in squares were the pair-wise calculation of r2 (left) and D’ (right); (C) qRT-PCR results showed a significant decrease of PSCA mRNA levels in GAC tissues compared with their adjacent normal tissues (Normal vs. tumor: Hap-CG, 1.90-fold, p = 0.028; Hap-TA, 2.19-fold, p = 0.029). PSCA mRNA was higher with Hap-TA than that with Hap-CG in normal tissues (Hap-TA vs. Hap-CG: 20-fold, p = 0.042). Results were expressed as the ratio of the CT value of the PSCA gene transcript to that of β-actin. The mean ± standard error (SE) was shown. * p < 0.05, normal vs. tumor; ** p < 0.05, Hap-TA vs. Hap-CG; (D) Immunohistochemistry (IHC) results revealed that PSCA protein was expressed in differentiated gastric epithelial cells, but silencing in most of GAC tissues (p < 0.01). For normal tissues, PSCA expression was higher with Hap-TA than that with Hap-CG (p < 0.05). For GAC tissues, the differentiation degree of Hap-TA was higher than that of Hap-CG (p < 0.05), Scale bar = 20 μm, Magnification: ×400.

