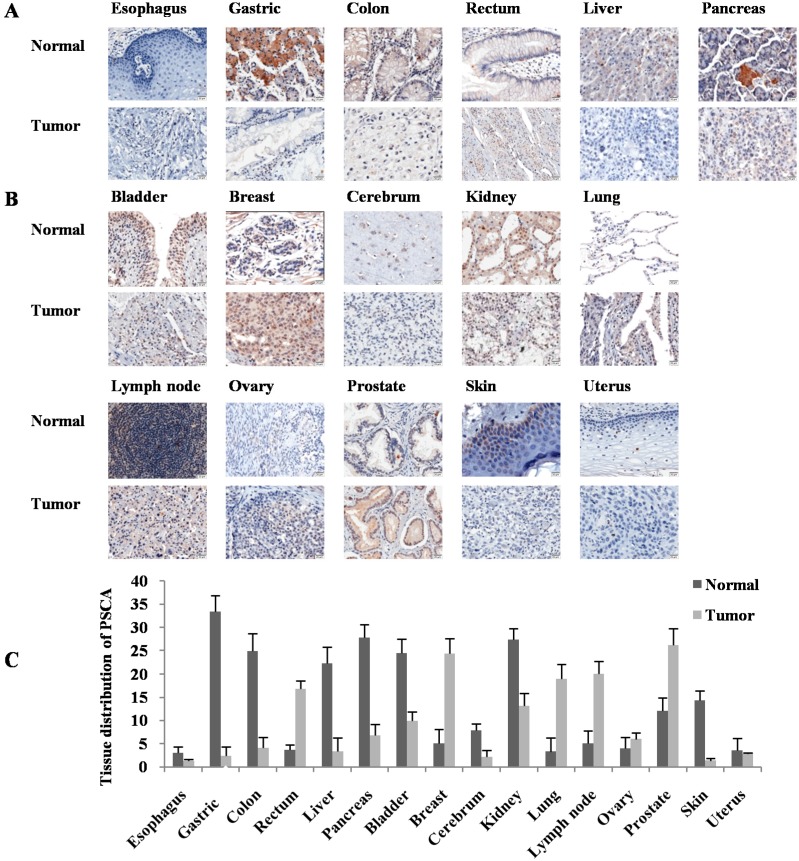
Figure 2.
Analysis of PSCA protein expression and distribution in human normal and tumor tissues by tissue microarray. (A) Digestive system. Esophagus, negative in both normal and tumor tissues; gastric, colon, liver and pancreas: Positive in normal, negative or down-regulated in tumor tissues; rectum: Negative in normal, and positive in tumor tissues, Scale bar = 20 μm, Magnification: ×200; (B) Non-digestive system. Bladder, cerebrum, kidney and skin: Positive in normal, and negative in tumor tissues; breast, lung, lymph node, ovary and prostate: Negative in normal, and positive in tumor tissues; uterus: Negative expression in both normal and tumor tissues, Scale bar = 20 μm, Magnification: ×200; (C) Semiquantitative comparison of PSCA immunostaining scores between normal and tumor tissues by IHC.

