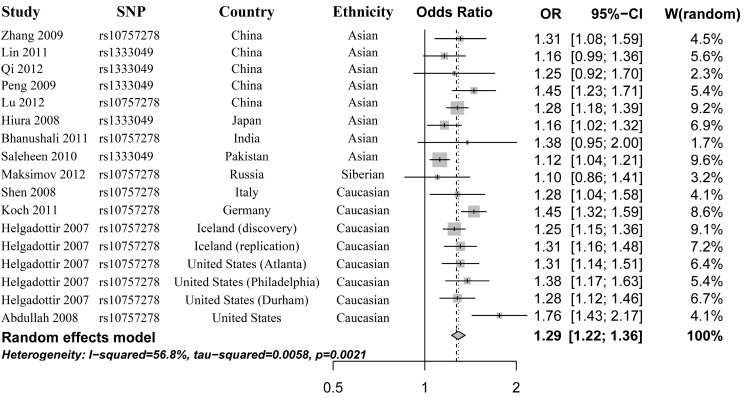
Figure 2.
Forest plot for the meta-analysis of rs10757278 polymorphism using an additive model. The risk alleles are G for rs10757278 polymorphism and C for rs1333049 polymorphism. The additive genetic model (allele model) for this meta-analysis can be described as G allele versus A allele for rs10757278, and C allele versus G allele for rs1333049. W, weight.

