Figure 1.
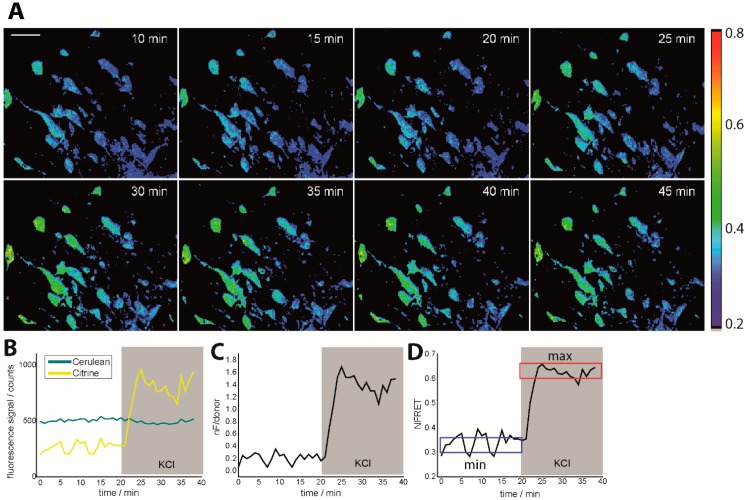
Intravital ratiometric FRET in healthy CerTN L15 mice. (A) Time-lapse of NFRET ratio of a 300 × 300 × 70 µm3 region in the brain stem of a CerTN L15 mouse before and during KCl treatment; (B) Cerulean and Citrine (donor and acceptor in TN L15) corrected averaged fluorescence signals during KCl treatment as well as averaged nF/donor ratio (C) and averaged NFRET ratio (D) time-evolutions. In (D), the blue frame defines the minimum NFRET ratio in healthy neurons, while the red frame defines the maximum NFRET ratio as given by treatment with KCl. The maximum NFRET ratio was validated by treatment with glutamate but is not the maximum reachable NFRET ratio as predicted by neurophysiology. The tolerance range for both minimum and maximum NFRET values is ≈0.1. CerTN L15 mice are genetically encoding the FRET-based Ca2+-biosensor TN L15 in neurons. λexc = 850 nm, λem (Cerulean) = 475 ± 20 nm, λem (Citrine) = 535 ± 25 nm. Scale bar = 50 µm. All images are represented as xyz projections.

