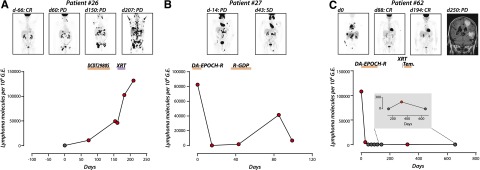
Figure 3.

Ig-HTS monitoring of therapeutic response. Time courses of plasma molecular disease during therapy; red, positive molecular disease; black, negative molecular disease. (A) Patient 26 achieved a CR after primary therapy with DA-EPOCH-R for stage IVE DLBCL, but had progression based on a day 60 PET/CT. Plasma molecular disease at this time point was positive. In the ensuing disease progression during several lines of therapy, disease burden can be seen to increase by both plasma molecular disease and PET/CT. (B) Patient 27 was treated for relapsed stage IVAE DLBCL with DA-EPOCH-R with stable disease shown by PET/CT on day 43. Plasma molecular disease decreased, but remained detectable on days 15 and 43. PD was detected by CT on day 77 (data not shown), corresponding with an increased disease burden by plasma molecular disease that again subsides, but remains detectable, following treatment with R-GDP. (C) Patient 62 was diagnosed with stage IVBE DLBCL including leukemic disease, and disease burden can be seen to decline as the patient achieves a CR. An isolated CNS relapse detected by magnetic resonance imaging on day 250 is also detected by Ig-HTS (day 323).
