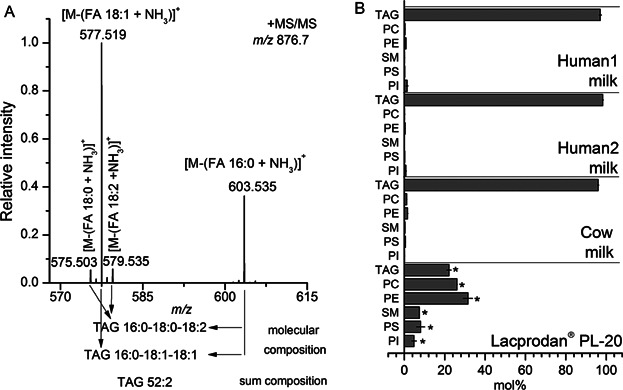
Figure 2.

(A) Positive ion mode TOF MS/MS spectrum of m/z 876.7, corresponding to ammoniated TAG 52:2. Fragment ions at m/z 575.503, m/z 577.519, m/z 579.535, and m/z 603.535 are correspond to the neutral loss of FA 18:0, FA 18:1, FA 18:0, and FA 16:0, respectively. (B) Lipid class composition of human milk, cow milk, and Lacprodan. Values represent average ±SD (n = 3 replicates). Asterisks denote lipid classes with abundances that are significantly different (p-value ≤0.01) as compared to the sample “Human1 milk.” Pairwise comparisons for all samples are reported in Supplementary Table S2.
