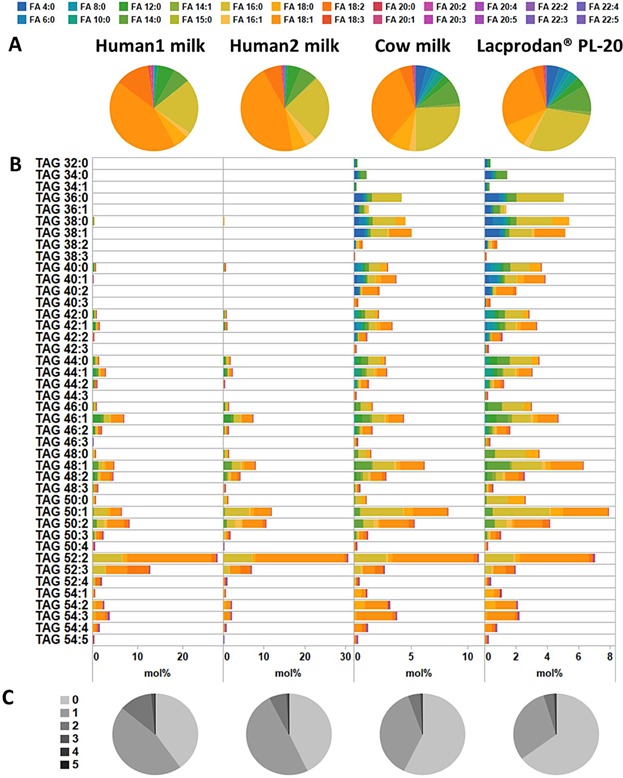
Figure 3.

Composites of TAG species in human milk, cow milk, and Lacprodan. (A) FA profile of TAG species. Data represent the percentage of individual FAs in all TAG molecules. (B) Composition of TAG species. Color coding shows the FA index for each TAG species (i.e., the proportion of each FA esterified to a TAG species annotated by sum composition). (C) FA unsaturation index for TAG species. Color coding shows the proportion of FAs with 0–5 double bonds. All values represent an average of three replicate analyses.
