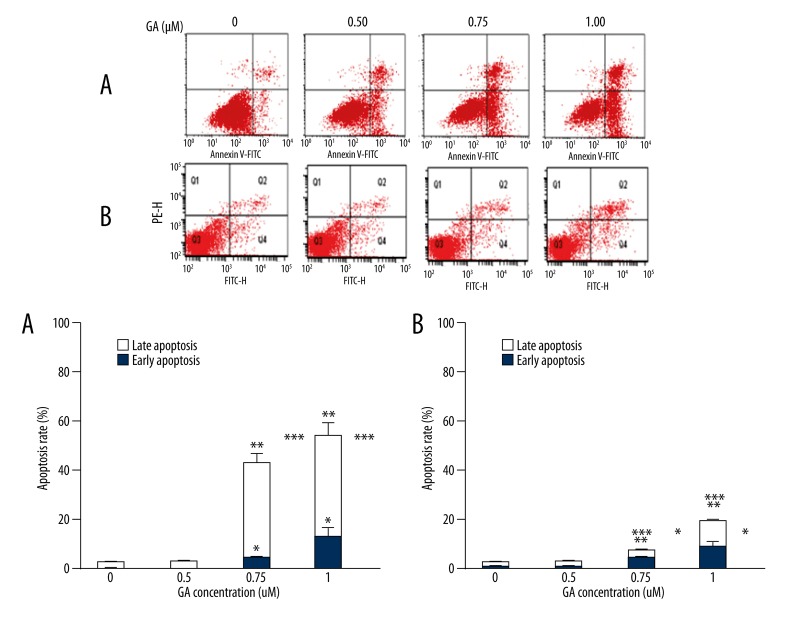
Figure 3.
Fluorescence-activated cell sorter analysis for Annexin-V and PI staining of K562 cells (A) and MNCs (B); early apoptotic cells were localized in the lower right quadrant of the dot-plot graph,* p<0.05 vs. 0 μM group, early apoptotic rate; ** p<0.05 vs. 0 μM group, late apoptotic rate;*** p<0.05 vs. 0 μM group, total apoptotic rate.

