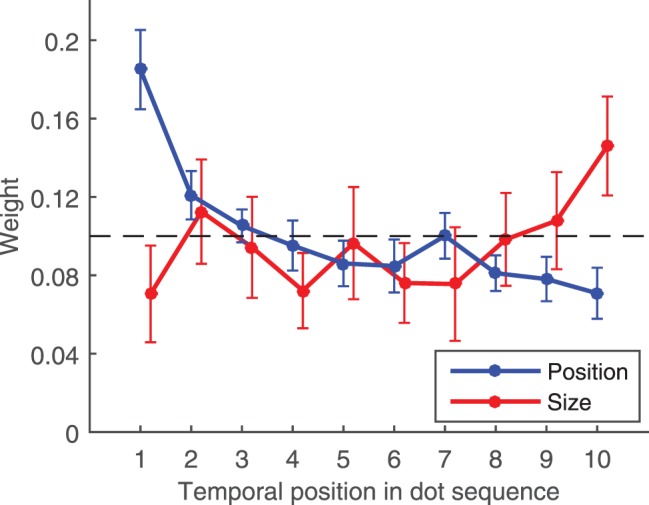
Figure 2.

Results from Experiment 1. Mean weights as a function of temporal position across all participants. X-axis indicates the temporal order of the dots shown, where 1 refers to the first dot presented on each trial and 10 refers to the last dot presented on each trial. Y-axis indicates the relative influence of each dot on participants' responses in each task. These weights were obtained by fitting a weighted average model to the data (see Results text for details). Dashed line indicates the weights expected if all dots contributed equally to responses and no other source of noise or bias were present. Weights from the size trials have been displaced rightward for readability. Error bars indicate 95% confidence intervals across participants.
