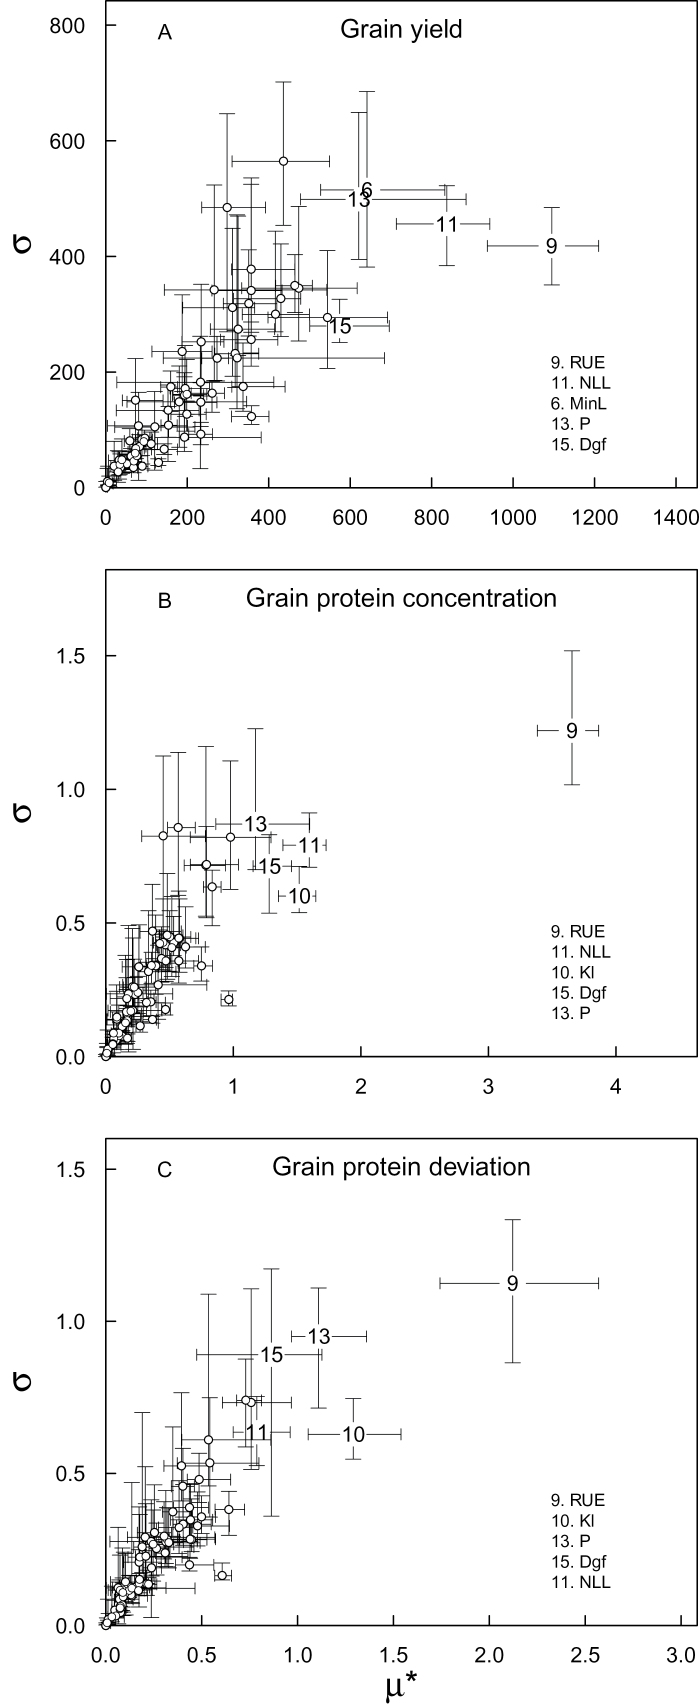
Fig. 3.
Median of the standard deviation (σ) versus median of the absolute mean (μ*) of the elementary effects for the 75 input parameters of the wheat simulation model SiriusQuality2 with respect to grain yield (A), grain protein concentration (B), and grain protein deviation (C) at Clermont-Ferrand under low N supply. The error bars are the 25% and 75% percentiles of σ and μ* for n=40 years, respectively. Only the five parameters with the highest μ* values are identified.

