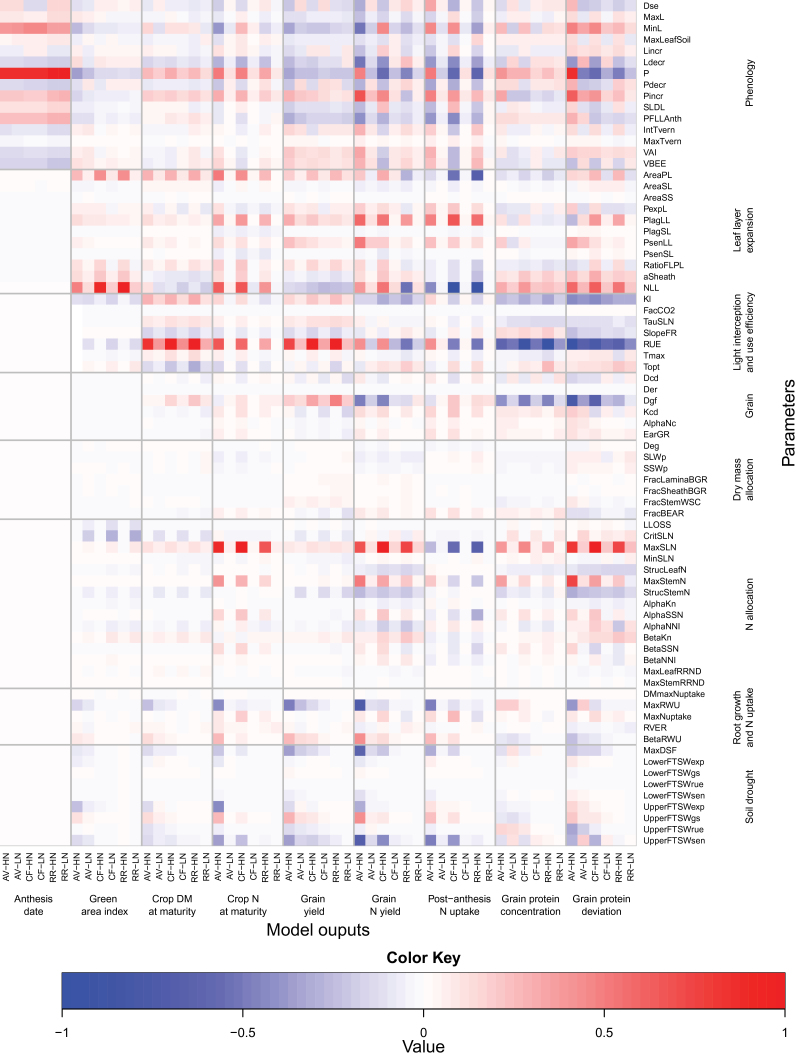
Fig. 4.
Heat map of the median values of the mean of the distribution of the absolute elementary effect (μ*) from the Morris screening analysis of the 75 input parameters of the wheat simulation model SiriusQuality2 on anthesis date, green area index, crop DM at maturity, crop N at maturity, grain DM at maturity, grain N at maturity, post-anthesis N uptake, grain protein concentration, and grain protein deviation. Simulations were performed at Avignon (AV), Clermont-Ferrand (CF), and Rothamsted (RR) under high (HN) and low N (LN) supplies for 40 years (1970–2009). The median of μ* was rescaled to [0, 1] across the sites and N treatments so for a given output they can be compared across the sites and N treatments. Negative values (blue colour) indicate that the parameter negatively influences the corresponding model output, and vice versa. The parameters were grouped according to the submodel to which they belong.

