
Figure 6.
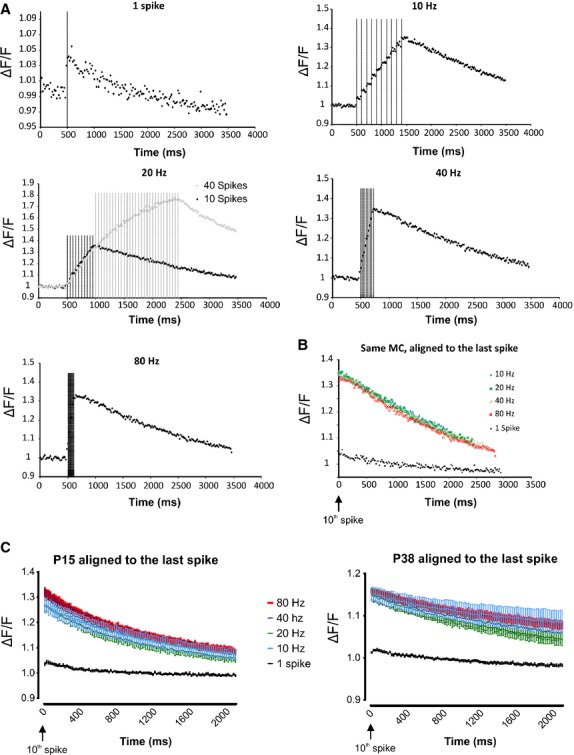
The intracellular somatic Ca2+ increase in the MC depends on the number of spikes but not on their firing frequency. (A) Representative example of the Ca2+ signal produced in a MC by the different firing frequencies. At 20 Hz, note that the Ca 2+ signal increases almost linearly when 40 spikes were generated, demonstrating that the Ca2+ influx produced by 10 spikes is below the saturation level of the Ca2+ probe used. The vertical lines represent the times of spike occurrence. (B) Same neuron, superposition of the ΔF/F at the end of the 10 spike train for the different firing frequencies; no obvious differences are observed. (C) Average of the ΔF/F at the end of the 10 spike train for the different firing frequencies for the P13 group (n = 13 MC) and for the P38 group (n = 14 MC). Within each group, no significant differences were observed between ΔF/F produced by the different firing frequencies. Error bars represent the SEM.