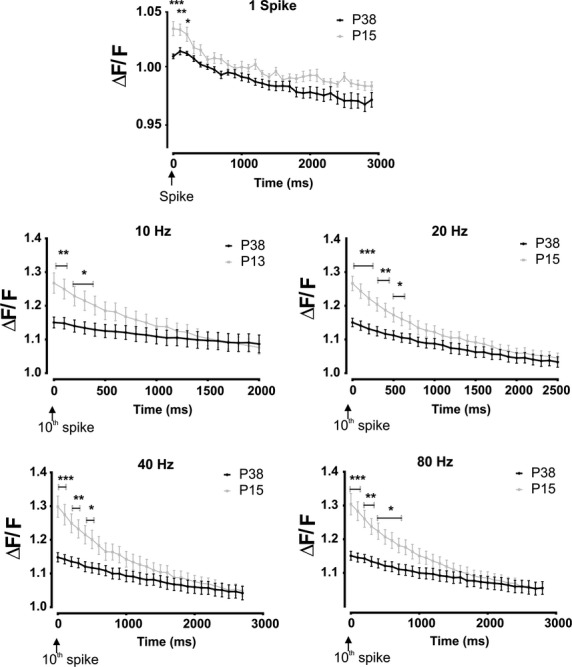
Figure 7.

The spike-induced intracellular Ca2+ increase is larger in MCs from P13 than in MCs from P38 rats for the entire firing frequency range tested. The graphs depict the time evolution of the ΔF/F after the last spike of each train. *P < 0.05, **P < 0.01, ***P < 0.001. Error bars represent the SEM.
