Figure 2.
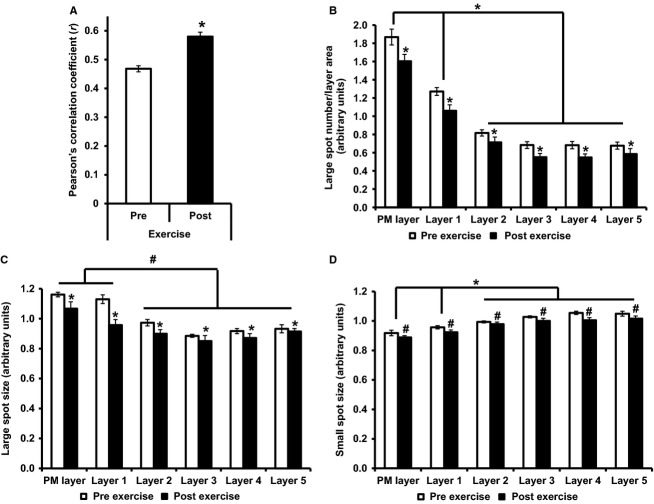
GLUT4 localization pre- and post-30 min exercise at 65% VO2 max. (A) Colocalization of GLUT4 with PM marker dystrophin, measured using the Pearson's correlation coefficient, paired t test *P < 0.001. (B) Large GLUT4 spot number, repeated measures ANOVA stimulation effect P = 0.005, cell layer effect P < 0.001, interaction P = 0.065, post hoc Bonferroni *P < 0.01, #P < 0.05. (C) Large GLUT4 spot size, repeated measures ANOVA stimulation effect P = 0.001, cell layer effect P = 0.001, interaction P = 0.131, post hoc Bonferroni *P < 0.01, #P < 0.05. (D) Small GLUT4 spot size, repeated measures ANOVA stimulation effect P = 0.038, cell layer effect P < 0.001, interaction P = 0.419 post hoc Bonferroni *P < 0.01, #P < 0.05. Graphs show mean ± SE, N = 10.

