Figure 3.

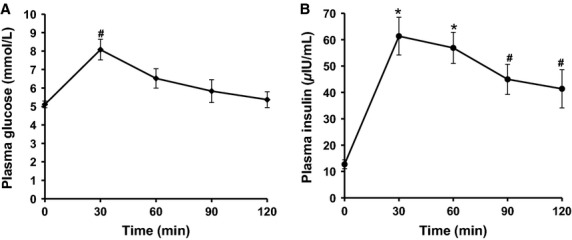
Plasma glucose and insulin during OGTT for experiment 2. Data presented are mean ± SE. N = 10. Repeated measures ANOVA glucose P < 0.001 (A), insulin P < 0.001 (B), post hoc Bonferroni pairwise comparisons *P < 0.01, #P < 0.05.

Plasma glucose and insulin during OGTT for experiment 2. Data presented are mean ± SE. N = 10. Repeated measures ANOVA glucose P < 0.001 (A), insulin P < 0.001 (B), post hoc Bonferroni pairwise comparisons *P < 0.01, #P < 0.05.