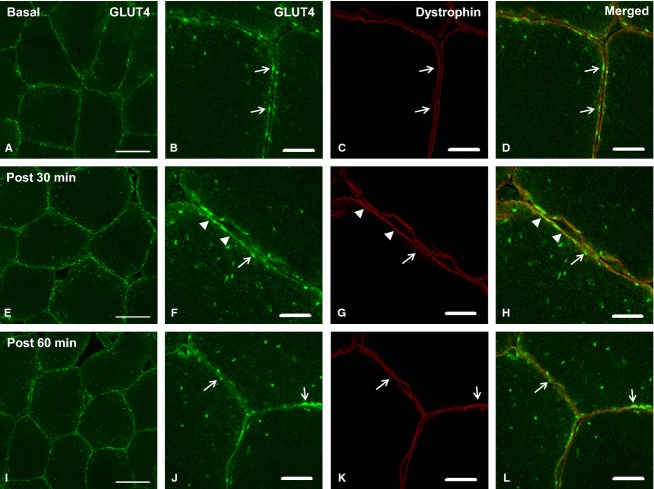
Figure 4.
Representative confocal immunofluorescence images of GLUT4 immunofluorescence in human skeletal muscle fibers in the basal state (A, B), 30 min post glucose ingestion (E, F) and 60 min postglucose ingestion (I, J) from experiment 2. Images A, E, and I show GLUT4 localization in green (scale bars 50 μm). Images B, F, and J show more detailed images of GLUT4 in PM regions (scale bars 10 μm). Images C,G, and K show the PM marker dystrophin in red (scale bars 10 μm). Merged images in D, H, and L demonstrate colocalization of GLUT4 with the plasma membrane marker dystrophin (scale bars 10 μm). Open arrows indicate clusters of GLUT4 at the PM, while filled arrow heads indicate moderate continuous GLUT4 signal at the PM.

