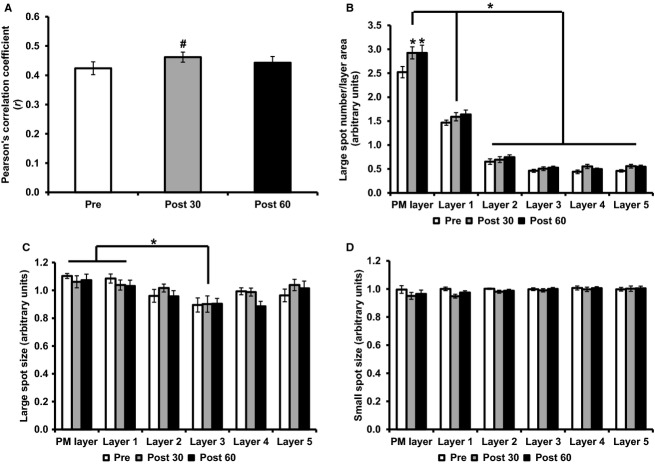
Figure 5.
GLUT4 localization pre and 30 min and 60 min postglucose ingestion. (A) Colocalization of GLUT4 with PM marker dystrophin, measured using the Pearson's correlation coefficient. Repeated measures ANOVA P = 0.008, *post hoc Bonferroni pairwise comparisons P < 0.05. (B) Large GLUT4 spot number, repeated measures ANOVA stimulation effect P = 0.001, cell layer effect P < 0.001, interaction P = 0.012, post hoc Bonferroni *P < 0.01, #P < 0.05. (C) Large GLUT4 spot size, repeated measures ANOVA stimulation effect P = 0.487, cell layer effect P < 0.001, interaction P = 0.588, post hoc Bonferroni #P < 0.05. (D) Small GLUT4 spot size, repeated measures ANOVA stimulation effect P = 0.055, cell layer effect P = 0.404, interaction P = 0.086. Graphs show mean ± SE, N = 10.

