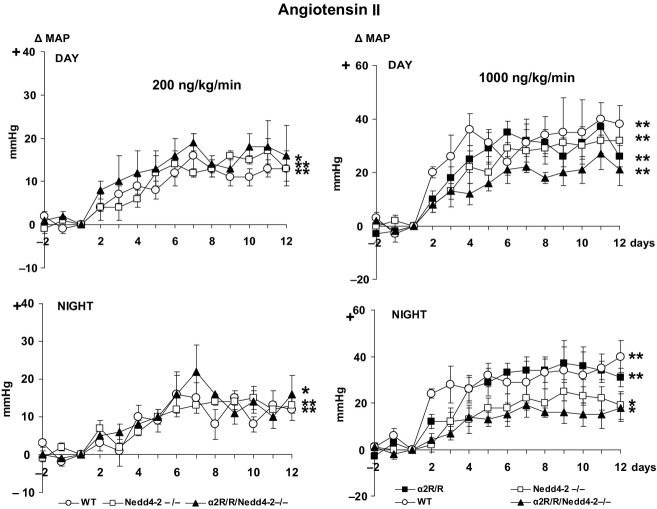
Effects of sc infusion of Ang II at 200 ng/kg/min (left panels) and at 1000 ng/kg/min (right panels) on mean arterial pressure (MAP) during the day and night in wild-type (WT) controls (
n = 6 and 5), Nedd4-2
−/− (
n = 4 and 6),

(
n = 7 for high dose only), and

/Nedd4-2
−/− (
n = 4 and 4). Values represent the mean ± SEM of the changes from baseline (day −1 to 0). **
P < 0.001; *
P < 0.05 versus baseline. Between-group changes were compared for areas under the curve:
BP Day:
low dose – WT:122 ± 14, Nedd4-2
−/−: 109 ± 11 and Nedd4-2
−/−/

: 172 ± 44.
F-value 1.4, P = 0.29.
High dose – WT:385 ± 71, Nedd4-2
−/−: 316 ± 53,

: 266 ± 58 and
Nedd4-2
−/−
: 189 ± 23.
F-value 1.4, P = 0.20.
BP Night:
low dose – WT:128 ± 18, Nedd4-2
−/−: 121 ± 19 and Nedd4-2
−/−/

: 147 ± 15.
F-value 0.5, P = 0.63.
High dose – WT:407 ± 92, Nedd4-2
−/−: 227 ± 45,

: 277 ± 57 and
Nedd4-2
−/−
: 161 ± 36.
F-value 2.4, P = 0.10.
 (n = 7 for high dose only), and
  /Nedd4-2−/− (n = 4 and 4). Values represent the mean ± SEM of the changes from baseline (day −1 to 0). **P < 0.001; *P < 0.05 versus baseline. Between-group changes were compared for areas under the curve:
 : 172 ± 44.
 : 266 ± 58 and
 : 189 ± 23.
 : 147 ± 15.
 : 277 ± 57 and
 : 161 ± 36.

