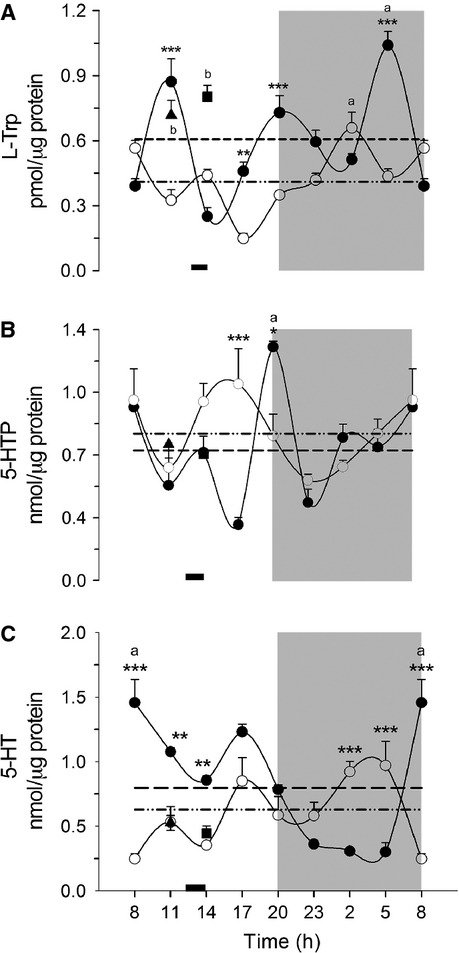
Figure 1.

Analysis of the daily variation of L-Trp (A), 5-HTP (B) and 5-HT (C) in rat liver measured by HPLC. Each point represents the mean ± SEM. Access to food for the DRF group is represented by the black bar (1200–1400 h). AL (●), DRF (○), Fa (▲), Fa-Re (■), mesor AL(─) DRF (−∙∙), (a) one-way ANOVA, post hoc Bonferroni test. *P < 0.05, **P < 0.01, ***P < 0.001, two-way ANOVA, post hoc Bonferroni test. (b) Student's t-test P < 0.05. n = 4. 5-HTP, 5-hydroxytryptophan; 5-HT, 5-hydroxytryptamine; HPLC, high pressure liquid chromatography; DRF, daytime restricted feeding; ANOVA, analysis of variance.
