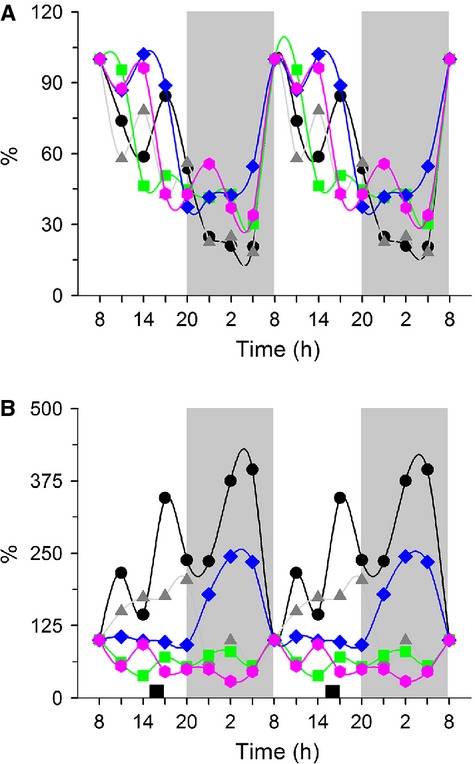
Figure 5.

Parameters of serotonin metabolism and transportation. (A) AL and (B) DRF group. Each point represents the average percentage of the value at the first time point, for each parameter analyzed. (●) 5-HT in liver, ( ) Enzymatic activity of TPH-1, (
 ) Relative level of TPH-1 protein, as well as (
 ) 5-HT in serum and (
 ) 5-HT in plasma. DRF, daytime restricted feeding; 5-HT, 5-hydroxytryptamine; TPH, tryptophan hydroxylase.
