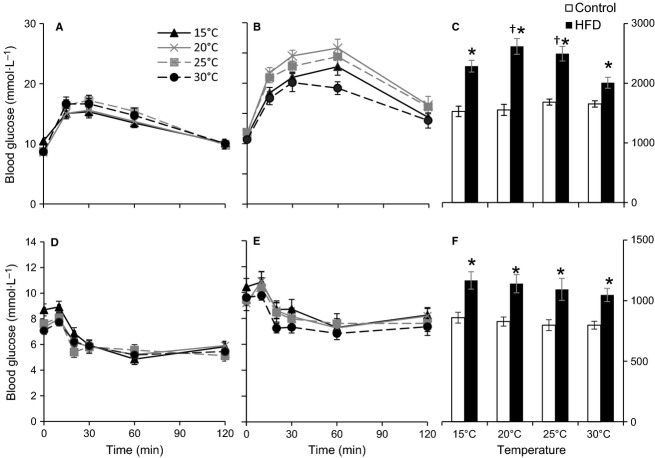
Figure 4.
Blood glucose concentrations of control (n = 10) (A, D) and high fat diet (HFD, n = 10) (B, E) C57/6JBom mice during glucose tolerance test (GTT) (A, B) and insulin tolerance test (ITT) (D, E) after 6 h long fast at different ambient temperatures. Calculated area under the curve (AUC) during GTT (C) and ITT (F). Data are presented as means ± SEM. A repeated measures ANOVA for AUCGTT revealed significant effects of temperature (P < 0.05) and diet (P < 0.0001), and a significant interaction between temperature and diet (P < 0.005). For AUCITT repeated measures ANOVA revealed no effects of temperature (P < 0.2) but a significant effect of diet (P < 0.005), and no interaction between temperature and diet (P < 0.6). *indicates significant effect of diet at the given temperature, whereas †indicates significant difference from 30°C within the same diet.

