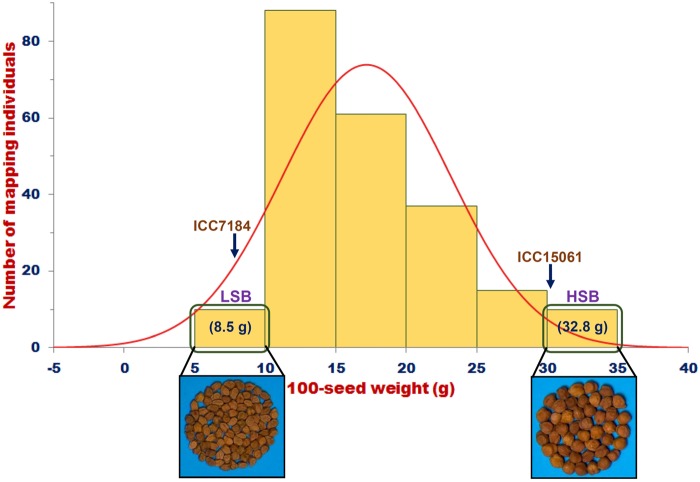
Figure 1.
Frequency distribution of 100-seed weight (g) in 221 individuals and parental genotypes of an intra-specific F4 mapping population (ICC 7184 × ICC 15061) depicted goodness of fit to the normal distribution. In LSB (low seed weight bulk) and HSB (high seed weight bulk), 100-seed weight varied from 5 to 10 g (mean 8.5 g) and 30 to 35 g (32.8 g), respectively. This figure is available in black and white in print and in colour at DNA Research online.

