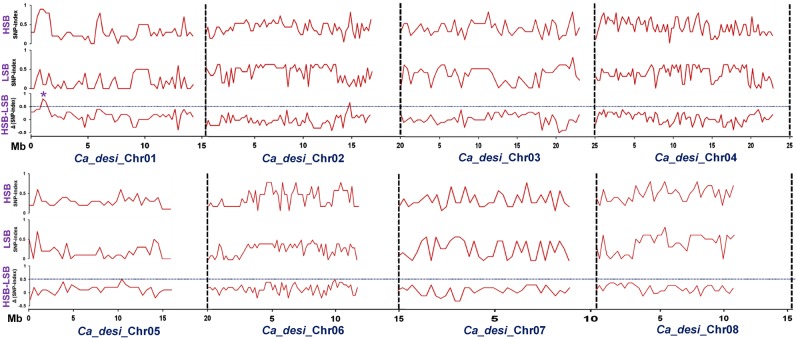
Figure 2.
SNP-index graphs depicting the HSB (high seed weight bulk), LSW (low seed weight bulk) and Δ (SNP-index) graphs generated from QTL-seq study. The X-axis denotes the physical positions (Mb) of eight desi chickpea chromosomes. The Y-axis represents the SNP-index, which is estimated according to 5 Mb physical interval with a 10 kb sliding window. Using the statistical confidence intervals under null hypothesis of no QTL (P < 0.05) as per Takagi et al.,42 the Δ (SNP-index) was plotted. One candidate major genomic interval (836,859–872,247 bp) (marked by asterisk) harbouring a robust SW QTL (CaqSW1.1) was defined using the criteria of SNP-index near to 1 and 0 in HSB and LSB, respectively, and the confidence value of Δ (SNP-index) above 0.5 (at significance level P < 0.05). This figure is available in black and white in print and in colour at DNA Research online.

