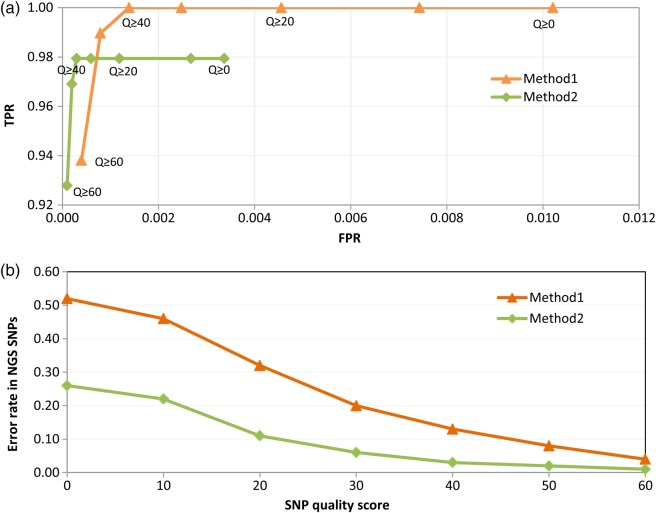
Figure 1.
Comparison of two methods of filtration on false discovery rates (FDRs) of SNP call. Method 1 represents filtration based on SNP quality scores (SNPQ) alone and Method 2 represents filtration based on SNPQ and evidence of non-reference or alternative allele by at least one forward- and one reverse-stranded reads. (a) ROC (receiver operating characteristic) curve plotting the true positive rate (TPR) against false positive rate (FPR). TPR is the sensitivity and is defined as the proportion of actual SNPs detected by Next Generation Sequencing (NGS). FPR is (1−specificity) and is defined as the fraction of non-SNP bases wrongly called as SNP by NGS. (b) Error rates or proportion of false positives (FPs) within NGS SNP set at different SNPQ. Both the figures indicate Method 2 as a better filtration approach in terms of FDR.

