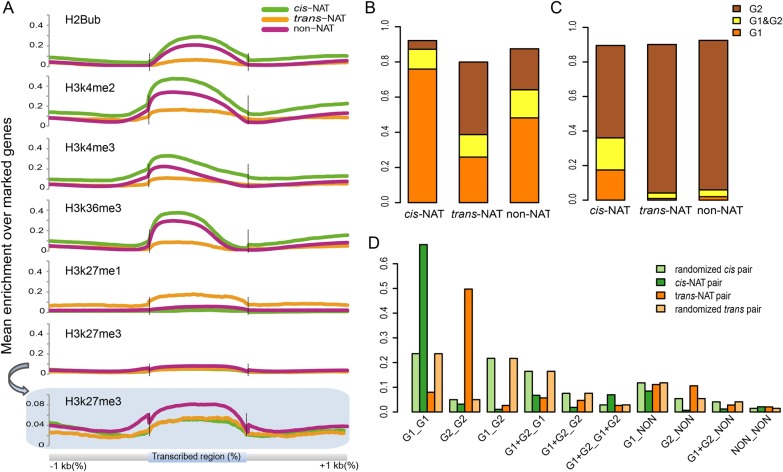
Figure 3.
(A) The enrichment degree of histone marks among cis-NAT, trans-NAT and non-NAT genes. The average enrichment levels are plotted along transcribed region (scaled to accommodate for different gene lengths, bin size of 1%) as well as the upstream (−1kb) and downstream (+1kb) sequences (bin size of 10 bp). (B and C) Histone modification patterns of cis-NAT, trans-NAT and non-NAT genes. Group1 (G1) means the modifications, H3K4me2, H3K4me3, H3K36me3 and H2Bub, which are euchromatic marks; Group 2 (G2) contains H3K27me1 and H3K27me3, which are heterochromatic marks. G1 and G2 represents genes targeted by marks both G1 and G2. (B) All genes in NAT types and (C) transposon elements only. (D) The divergence histone modifications of two genes in each NAT pair. Different bars shows the percentages of genes of cis-NATs, trans-NATs, randomized cis pairs and randomized trans pairs in ten classes of modification patterns (G1_G1, G2_G2, G1_G2, G1+G2_G1, G1+G2_G2, G1+G2_G1+G2, G1+G2_NON, G1_NON, G2_NON and NON_NON). G1, G2 are euchromatic and heterochromatic marks, same as above. NON refers to genes are not marked by above six histone modifications.This figure is available in black and white in print and in colour at DNA Research online.

