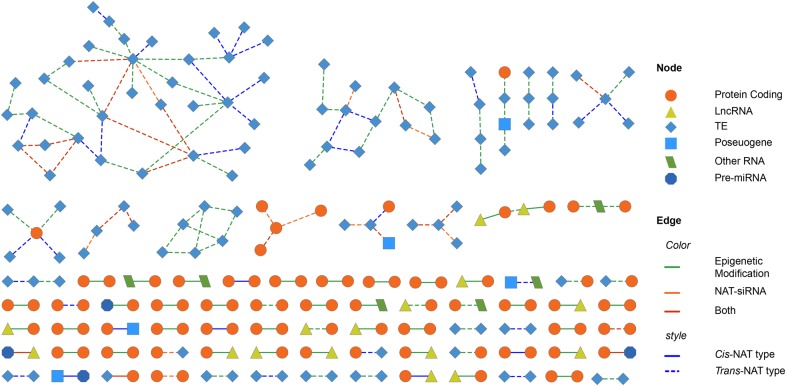
Figure 5.
The expression network of NAT-genes. The network was constructed by the NAT pairs with expression correlation |PCC| ≥ 0.8. The solid and dash edge shows cis- and trans- type of the pair. Both means both of highly similar or distinct epigenetic modification and NAT-siRNA production features happen between this NAT pair. (PCC: Pearson correlation coefficient.) This figure is available in black and white in print and in colour at DNA Research online.

