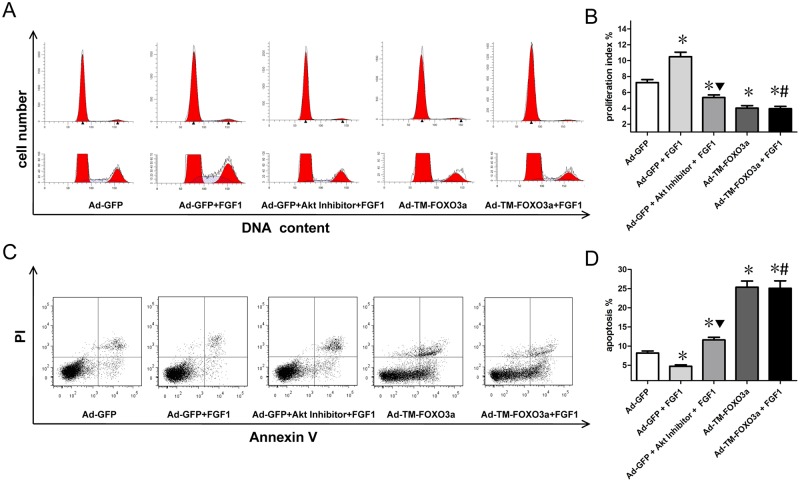
Fig 4. FGF1 enhanced EPC proliferation and protected EPCs from apoptosis associated with Akt and FOXO3a signals.
(A) Cell proliferation was detected by PI/RNase staining and analyzed with flow cytometry. (B) Proliferation Index (PI) was used to evaluate EPC proliferation. PI = (S+G2M)/(G0/1+S+G2M). Data are mean ± SD, n = 3, One-way ANOVA was used for statistical analysis, *P<0.05 vs Ad-GFP; ▼P<0.05 vs Ad-GFP+FGF1; #P = NS vs Ad-TM-FOXO3a. (C) Cell apoptosis was detected by Annexin V and PI dual staining and analyzed with flow cytometry. (D) The percentage of apoptotic cells with Annexin V positive expression was used to assess EPC apoptosis. Data are mean ± SD, n = 3, One-way ANOVA was used for statistical analysis, *P<0.05 vs Ad-GFP; ▼P<0.05 vs Ad-GFP+FGF1; #P = NS vs Ad-TM-FOXO3a.

