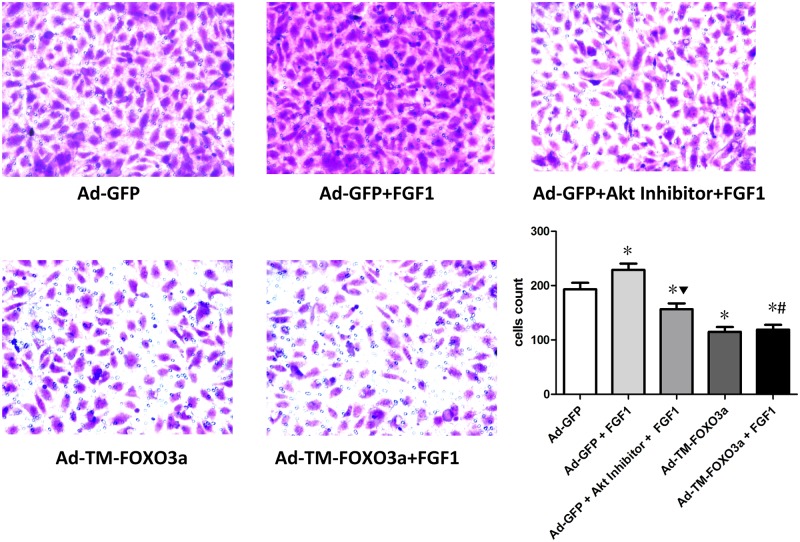
Fig 5. FGF1 improved EPC migration associated with Akt and FOXO3a signals.
The representative photomicrographs from Transwell assay were shown (magnification×200). Three randomly microscopic fields were selected to enumerate the cells. Data are mean ± SD, n = 3, One-way ANOVA was used for statistical analysis, *P<0.05 vs Ad-GFP; ▼P<0.05 vs Ad-GFP+FGF1; #P = NS vs Ad-TM-FOXO3a.

