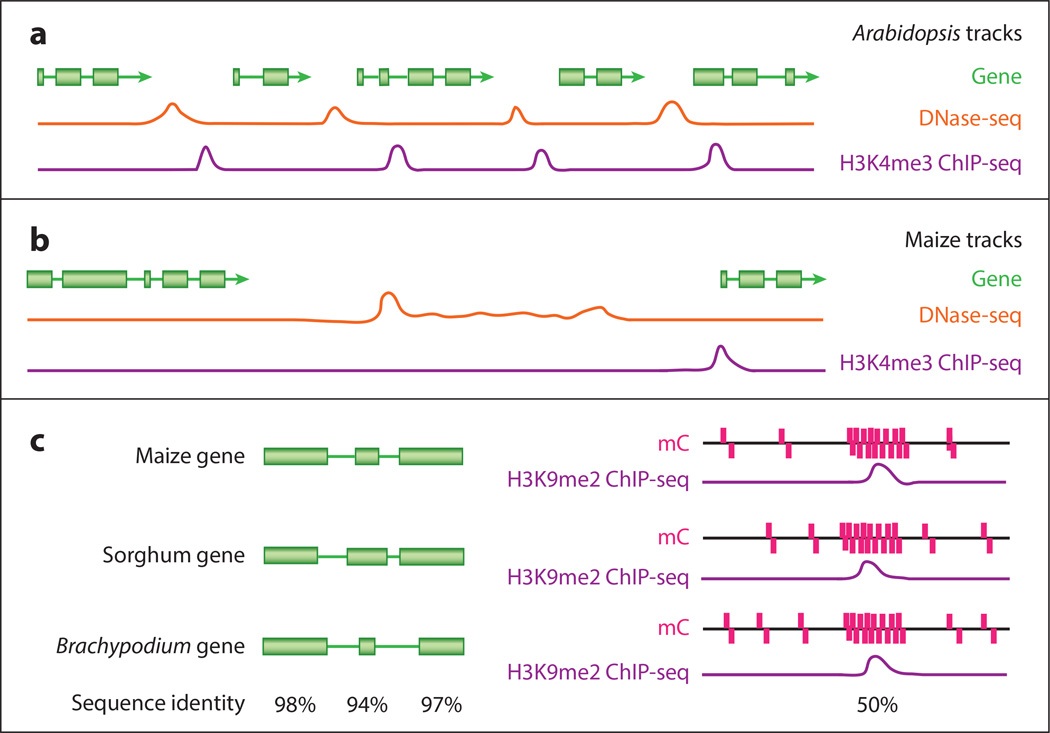
Figure 1.
This model is a simplified version of the data that would be uncovered through a comparative epigenomics browser. (a) Shorter intergenic space in a smaller, more compact genome, such as Arabidopsis, allows for location of DNA elements without the need for several data sets. The area in which these elements can be located is restricted. Here, this is modeled by peaks for DNA elements in H3K4m3 ChIP-seq (purple) and DNase-seq (orange) data sets. H3K4me3 is associated with transcriptional start sites, and DNase-seq is associated with promoter regions. They are located between each gene model (green), and either data set would clearly define them. (b) Larger genomes, such as maize, can have much larger intergenic spaces, as depicted here. These region lengths can make locating DNA elements more difficult because data sets may not have a single clear peak. However, multiple data sets locating points of consistency can lead to clearer recognition of these DNA elements. (c) When comparing related species, important conserved elements, such as genes (green), can be easily annotated through sequence identity (black; below both halves of the figure) as a percent of the sequence conserved across species. A model is shown on the left of the figure. However, there are cases in which sequence conservation is not enough to identify important elements, especially in short sequences. A model is shown on the right, which could occur in a promoter region. In this example, even though there is low sequence identity at the nucleotide level, a combination of conserved methylation data (mC; pink) and H3K9me2 ChIP-seq data (purple) is used to accurately identify an important genomic region.

