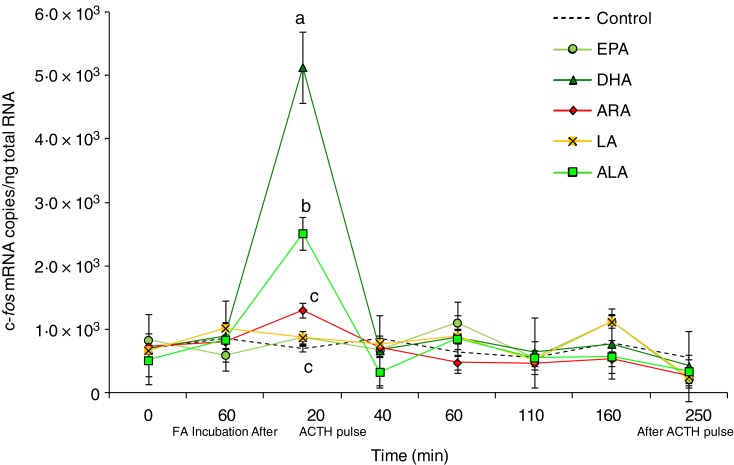
Fig. 3.
Expression levels of the c-fos gene measured by real-time PCR in Dicentrarchus labrax head kidney cells in the course of the perfusion trial. c-fos mRNA copy number was normalised as a ratio to 100 ng total RNA. Cells were sampled after the stabilisation period (0 h), 60 min after highly unsaturated fatty acids (FA) incubation (EPA, DHA, arachidonic acid (ARA), linoleic acid (LA) and α-linolenic acid (ALA)), 20 min after adrenocorticotrophin hormone (ACTH) stimulation, and then sequentially at 40, 60, 110, 160 and 250 min following the ACTH pulse. The means of three replicates in each sampling point are shown. Bars indicate standard error of the mean. Differences were determined by one-way ANOVA and each time point was analysed separately. A post hoc test was applied (Tukey). a,b,c Different letters indicate significantly different means from controls, for the time point tested (P < 0·01).

