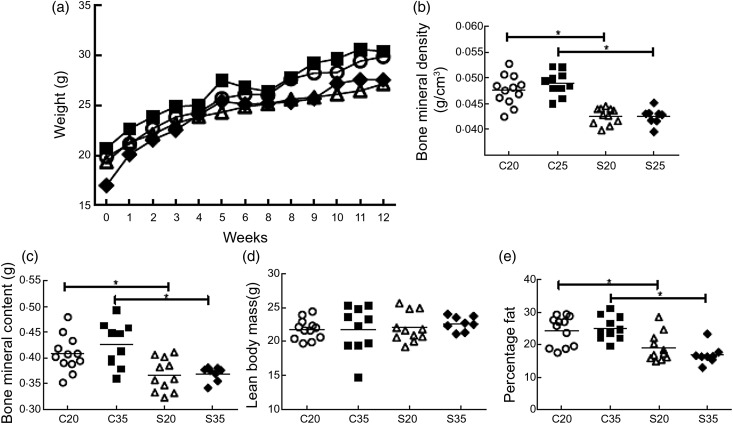
Fig. 1.
Effect of diet on body composition of sickle and control mice fed either 20 or 35 % of energy from protein for 3 months. Weight values represent the mean weekly weight per group (a). Bone mineral density (b) and bone mineral content (c) of control mice were significantly higher than for sickle mice regardless of diet. Lean body mass (d) was not different across the groups. Sickle mice had a significantly lower percentage of fat than control mice (e). Body composition was plotted individually and the mean value for all mice represented by the horizontal line. C20, control mice fed a diet supplying 20 % energy from protein (○); C35, control mice fed a diet supplying 35 % energy from protein (■); S20, Berkeley sickle mice fed a diet supplying 20 % energy from protein (△); S35, Berkeley sickle mice fed a diet supplying 35 % energy from protein (◆). * P < 0·05.

