
Figure 6. DFT calculations.
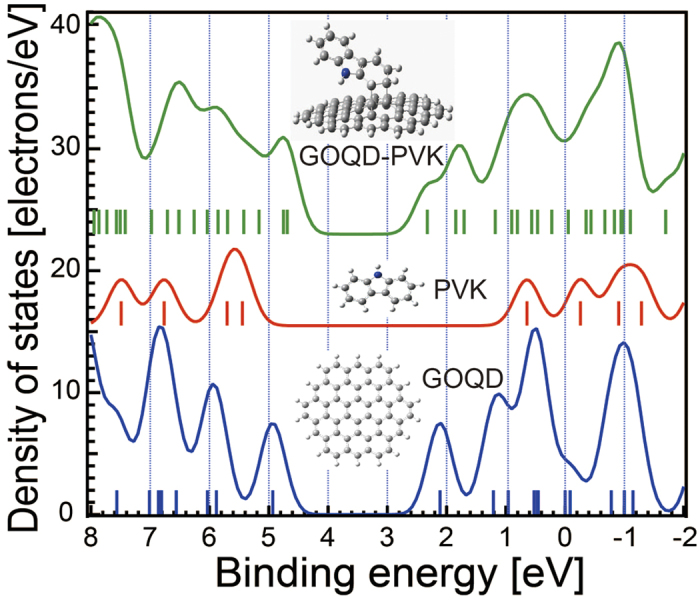
Simple simulation using DFT for the calculation of molecular orbital (MO) levels and density of states (DOS) of pristine GOQD, PVK and GOQD-PVK complex. The DOS of pristine GOQD (blue line), pristine PVK (red line) and GOQD-PVK (green line) are shown. The binding energy of each MO is indicated with vertical bars. The insert image shows the most stable formation of pristine GOQD, PVK and GOQD-PVK with this calculation.