
Figure 3.
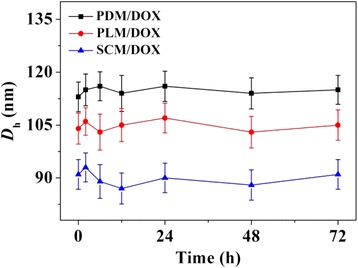
D h changes of PDM/DOX, PLM/DOX, and SCM/DOX versus time in PBS at pH 7.4, 25°C. Each datum was represented as mean ± SD (n = 3).
Official websites use .gov
A
.gov website belongs to an official
government organization in the United States.
Secure .gov websites use HTTPS
A lock (
) or https:// means you've safely
connected to the .gov website. Share sensitive
information only on official, secure websites.
D h changes of PDM/DOX, PLM/DOX, and SCM/DOX versus time in PBS at pH 7.4, 25°C. Each datum was represented as mean ± SD (n = 3).