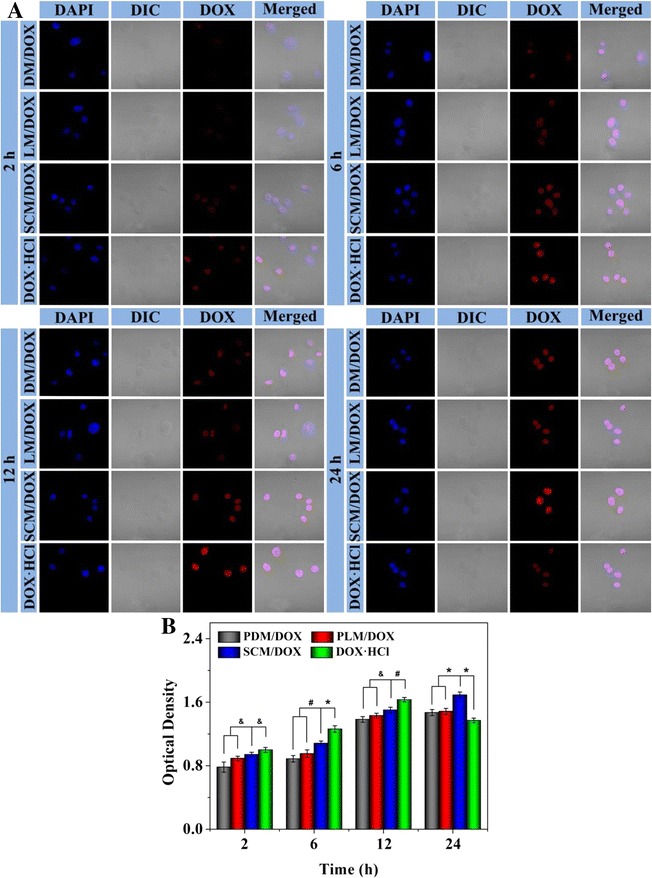
Figure 6.

Intracellular DOX internalization of PDM/DOX, PLM/DOX, SCM/DOX, and free DOX · HCl groups after coculture for different periods of time (A), and statistical analysis of optical density of DOX fluorescence intensity (B). The data were shown as mean ± SD (n = 4; & p < 0.05, # p < 0.01, and *p < 0.001).
