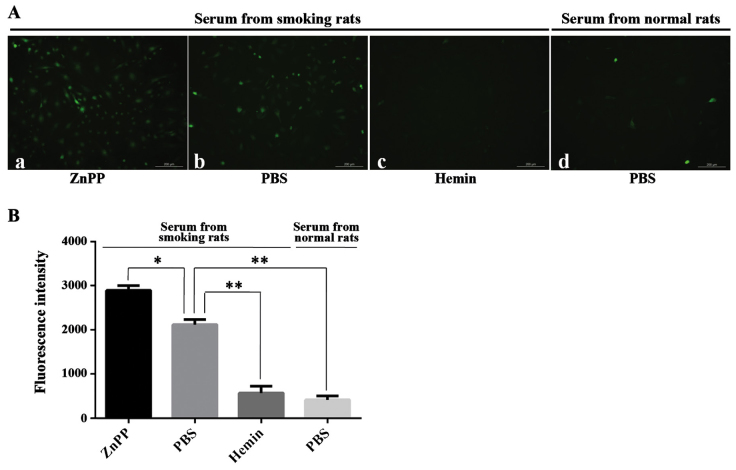
Figure 4.
Content of ROS in HUVECs in various treatment groups. (A) HUVECs observed under the fluorescence microscope (scale bar, 200 µm). The fluorescence intensity represents the content of ROS. (a) HUVECs pre-treated with ZnPP and incubated in the serum of smoking rats; (b) HUVECs pre-treated with PBS and incubated in the serum of smoking rats; (c) HUVECs pre-treated with hemin and incubated in the serum of smoking rats; (d) HUVECs pretreated with PBS and incubated in the serum of normal rats. (B) Quantification of the content of ROS through measurement of fluorescence intensity. *P<0.05, **P<0.01, values are expressed as the mean ± standard deviation of 3 repetitions. ZnPP, zincprotoporphyrin IX; PBS, phosphate-buffered saline; HUVEC, human umbilical vascular endothelial cell; ROS, reactive oxygen species.

