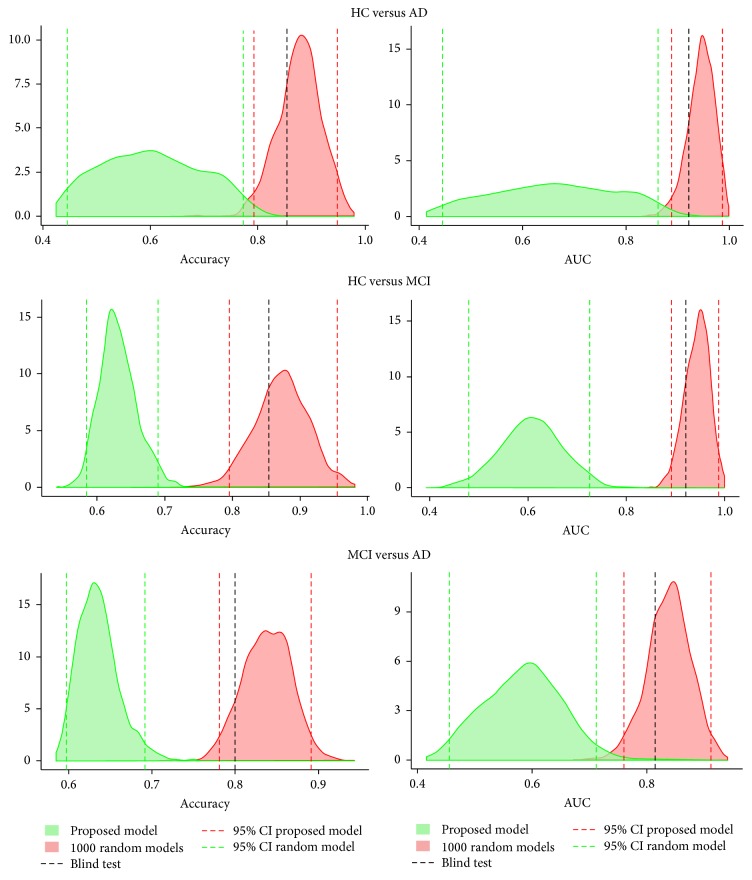
Figure 3.
Accuracy and AUC of the proposed and random models. Red density distributions show the accuracy and AUC from the 1,000 bootstrap samples in the calibration set. Green density distributions show the accuracy and AUC from the 1,000 random models, each one evaluated using also 1,000 bootstrap samples in the calibration set. The black dashed line represents the accuracy and AUC evaluated in the test set.

