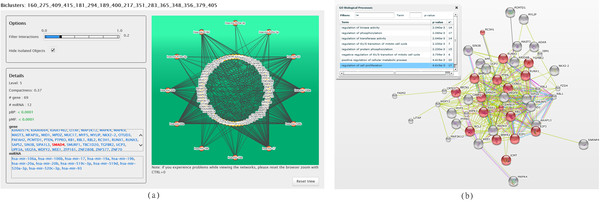
Figure 8.

Bicluster Y in ComiRNet (a) and the enrichment of its genes in STRING (b). The represented bicluster Y (shown with the filter on the interaction score set to 0.2), is obtained by searching for the MGRNs involving the gene SMAD4 in the fifth level of the hierarchy 3 (α = 0.1, β = 0.5), applying filters on the minimum compactness (0.3) and on the maximum pBP (0.05). In STRING, red nodes are those involved in the category (i.e., biological process) selected in the enrichment analysis table.
