
Fig. 10.
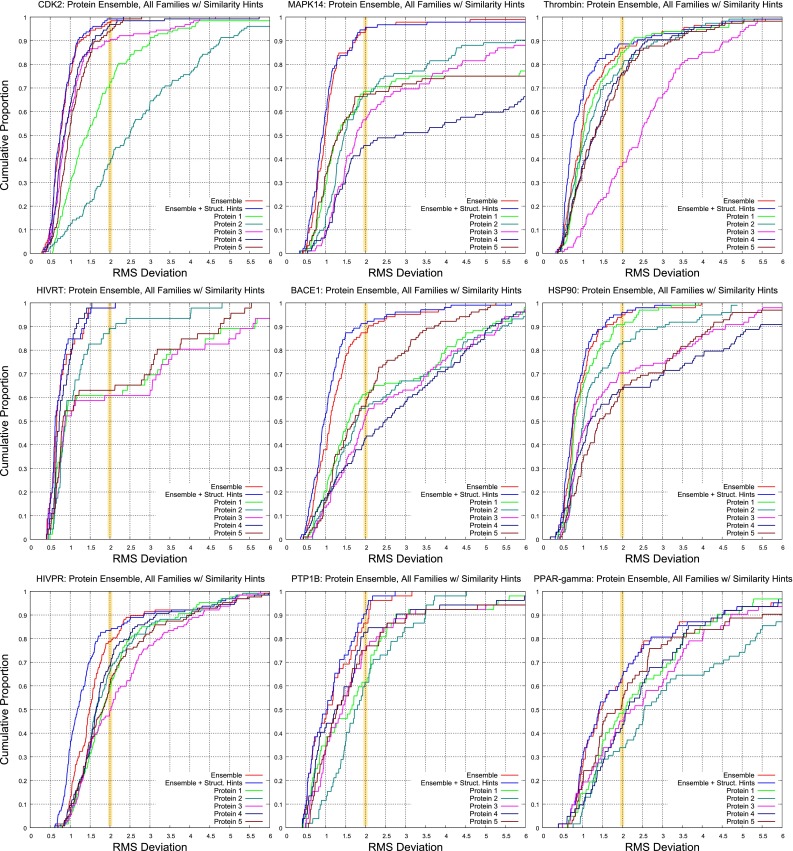
The effects of using single protein exemplars versus an ensemble of five for nine targets. The key comparisons are between the red curve (protein ensemble with no substructural guidance during docking), blue curve (adding substructural guidance), and the remaining curves (each from a single protein variant from the ensemble, using no substructural guidance)