
Fig. 9.
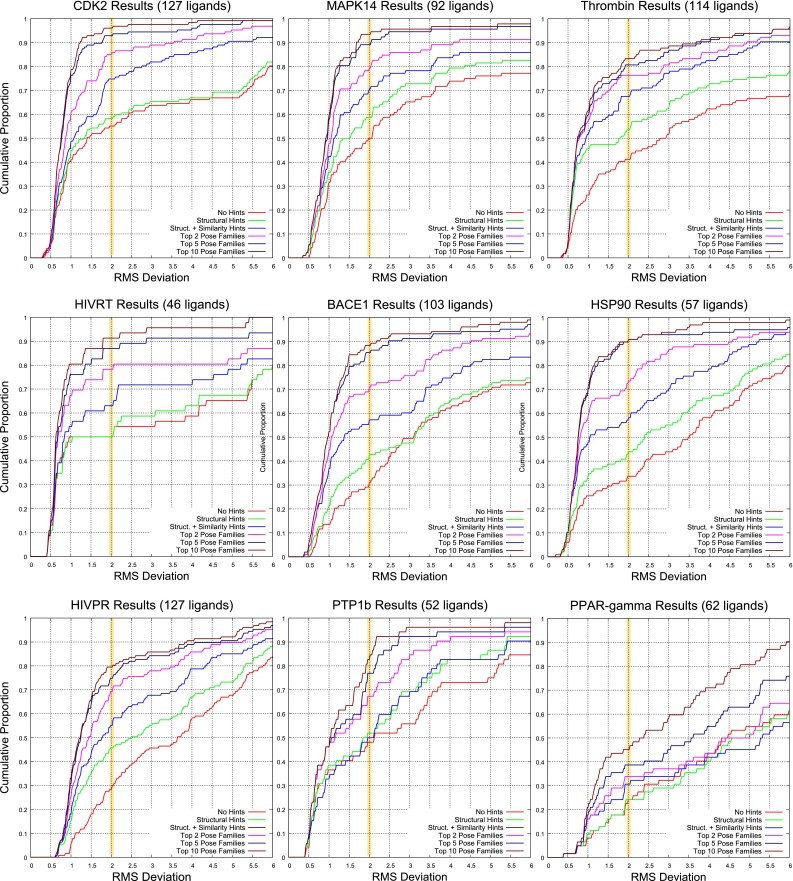
Overall docking performance under different docking protocols for nine targets. The key curves are blue (top scoring pose family using the knowledge-guided protocol), magenta (top two pose families), and red (top pose family in the unguided protocol)