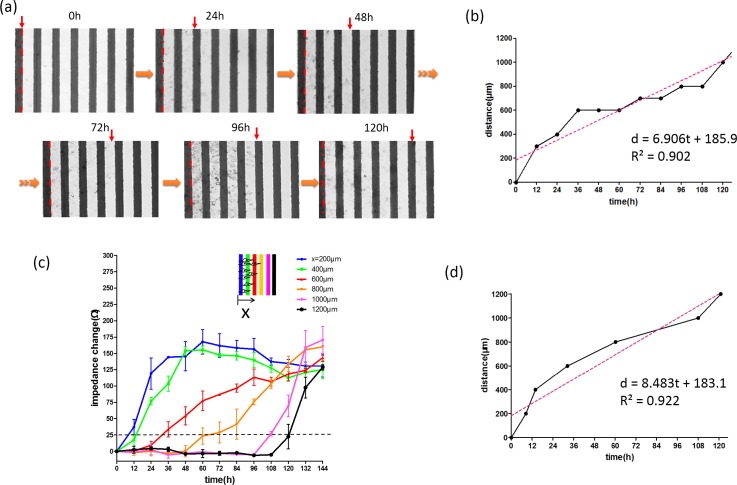
FIG. 4.
Analyses of cell migration activity. (a) Successive images of cell migration process. The red dashed line represents the start line of the cell migration process. The red arrow indicates the leading edge. (b) Relationship between the migration distance and time identified from the images is shown in (a). (c) Impedance measurements across six pairs of electrodes at distances of 200, 400, 600, 800, 1000, and 1200 μm at different successive time points. Error bars represent the standard deviations of three repeated experiments. (d) Relationship between the migration distance and time calculated from the impedance data is shown in (c).

