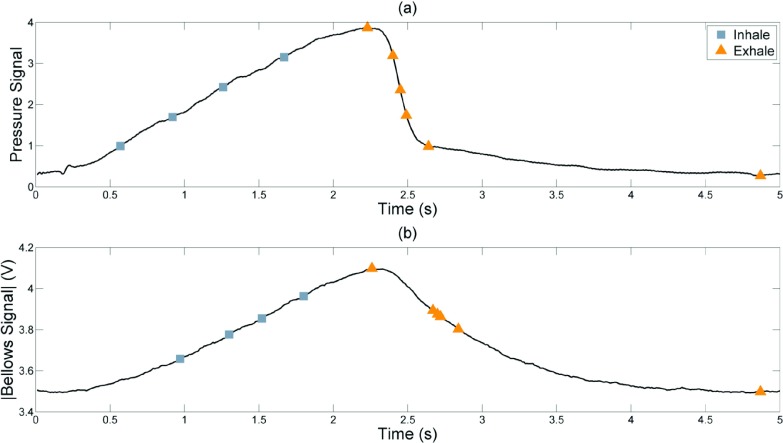
FIG. 4.
Breathing amplitude points at which the Siemens images were reconstructed (a) and their corresponding bellows voltages (b). Peak intratracheal pressure buildup occurred slightly before peak lung volume and also fell off more rapidly, causing the abdominal bellows signal shown in (b) to lag behind the pressure waveform and have a different shape. Consequently, the first exhalation reconstruction point appears to be during inhalation on the bellows signal and subsequent exhalation points are not evenly spaced.

