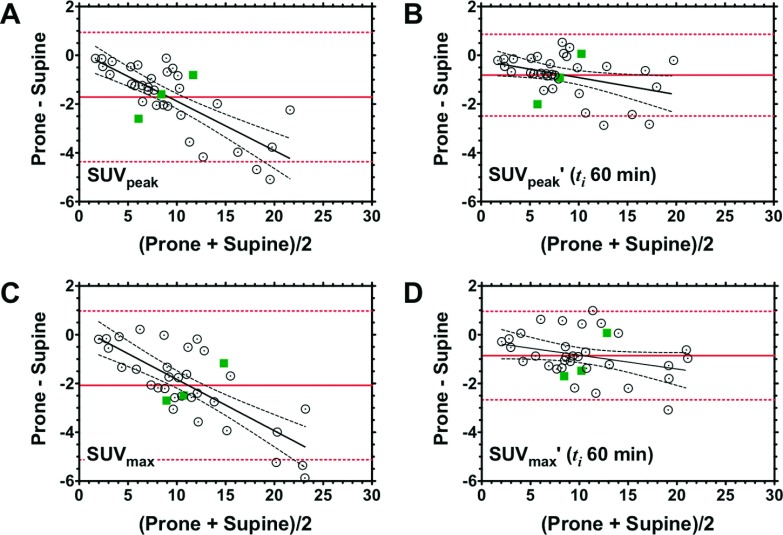
FIG. 5.
Agreement between prone and supine measurements of SUVpeak and SUVmax, before and after correcting for uptake time differences. Original SUVpeak (A) and SUVmax (C) and uptake time-adjusted (ti = 60 min) SUVpeak′ (B) of SUVmax′ (D). Bland–Altman plots for prone and supine data, expressed as the difference between the two positions (prone-supine), are plotted on the abscissa; corresponding mean values (i.e., average of prone and supine) are plotted on the ordinate. Solid horizontal lines represent the mean prone-supine difference. Slope estimates (difference versus mean) were obtained from linear regression. Dashed lines represent the 95% confidence interval. Squares represent example subjects illustrated in Fig. 7.

