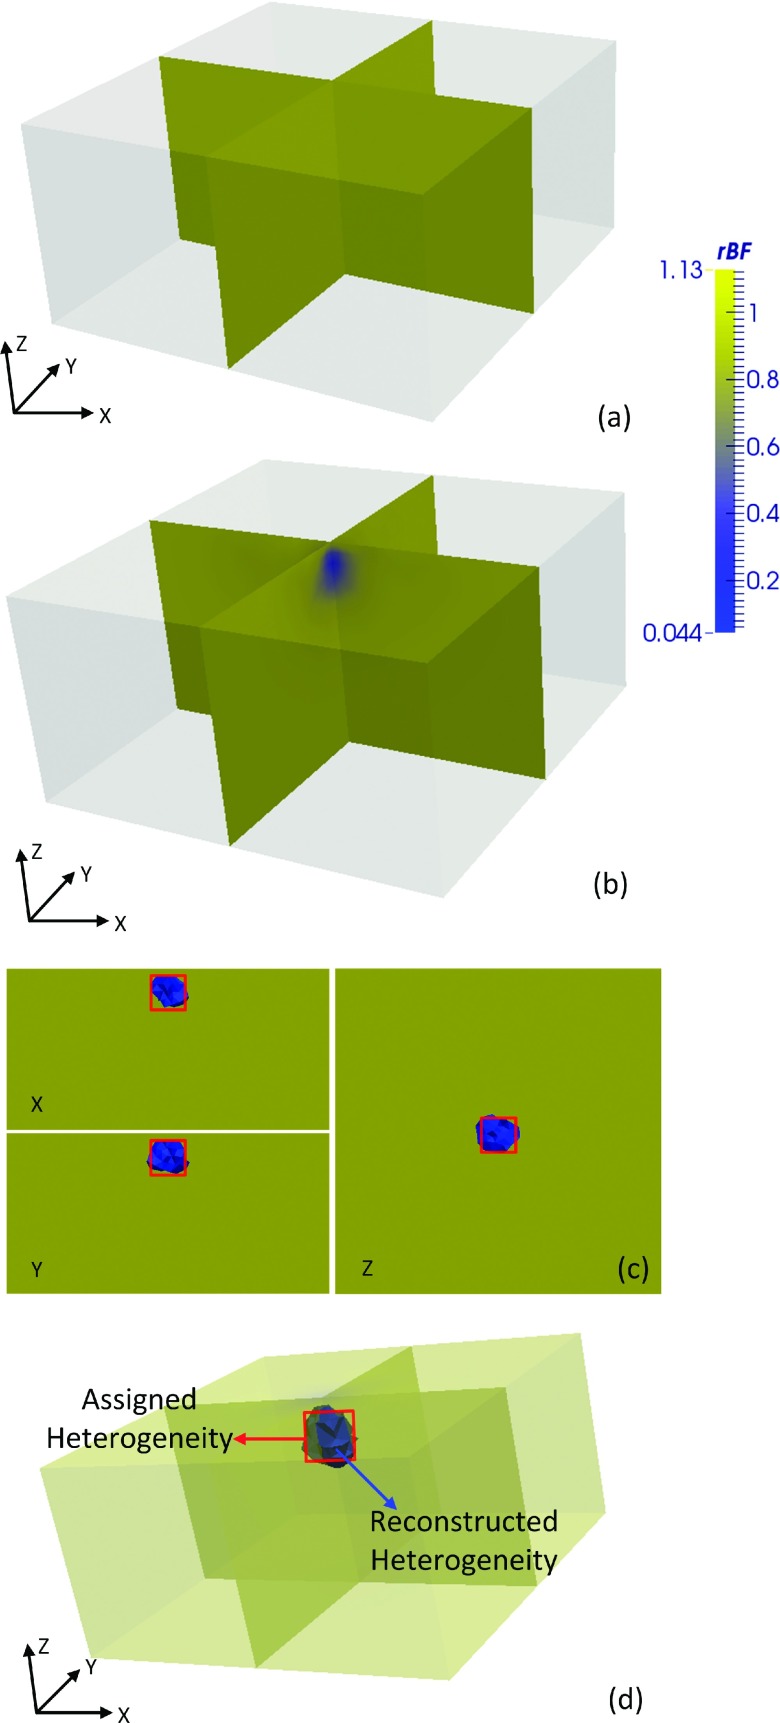
FIG. 5.
Reconstructed 3D flow contrasts. Three-dimensional overlaid cross-sectional views of the slab phantom (a) without heterogeneity and (b) with heterogeneity. (c) Two-dimensional cross-sectional view (x and y through side centers; z at 24.5) of the region with heterogeneity as extracted by half max contrast threshold criteria. The true region with heterogeneity is depicted by centered squares. (d) The extracted (half max contrast threshold) region with heterogeneity obtained by computer simulation. Images displayed with ParaView (Kitware, NY).

