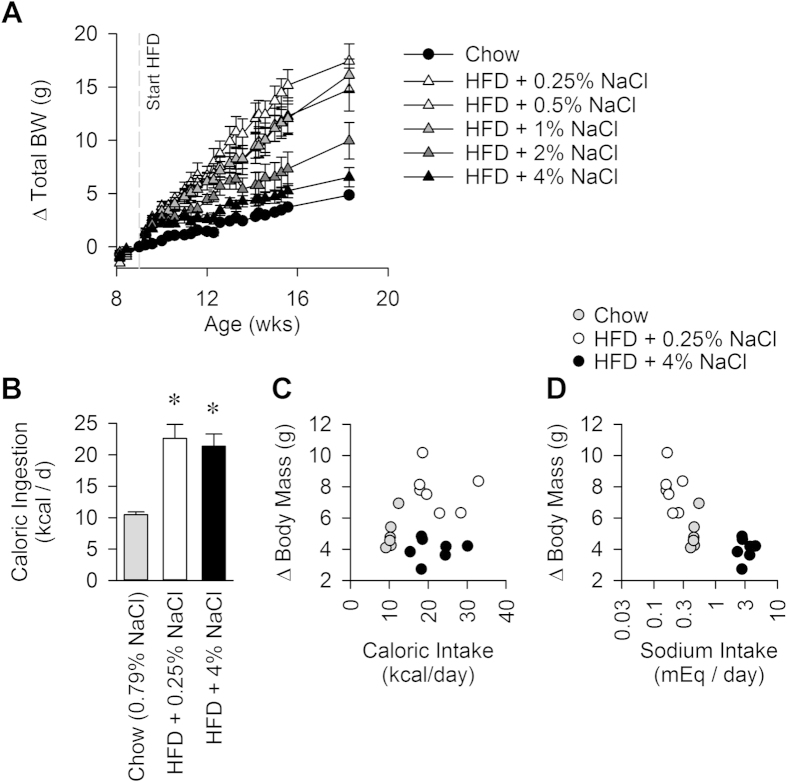
Figure 1.
(A) Body mass gains over time on various diets. 2-way RM ANOVA: Diet P < 0.001, Time P < 0.001, Diet x Time P < 0.001. N = 5 for each group. (B) Daily caloric ingestion during the 5th week of dietary intervention. (C) Correlation of body mass gained vs daily caloric intake. (D) Correlation of body mass gained vs daily sodium intake. N = 6 chow, 7 HFD + 0.25% NaCl, and 7 HFD + 4% NaCl. (Panels B–D). *P<0.05 vs Chow.

