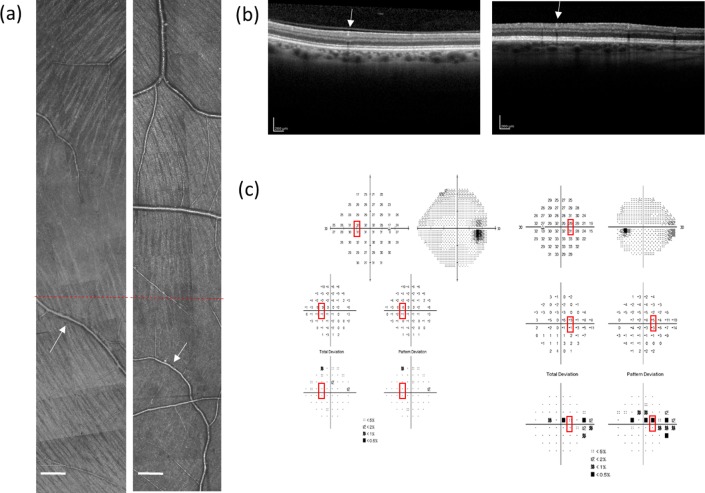
Figure 5.
Example of AOSLO montages, OCT images, and visual fields from two subjects. (a) The RNFL montages constructed from AOSLO images. The left image is from a control subject and the right from a patient, where bundles are barely observed in the lower half of the image. Red dashed lines in both montages indicate the horizontal midline. Scale bar: 200 μm. (b) Optical coherence tomography images in the same region. Left is from the control and the right is from the patient. The white arrows in (a) and (b) point to the same vessels in AO montages and OCT images. (c) Corresponding 24-2 visual field reports. Left and right are from the control and the patient respectively. Red boxes indicate testing locations that fall within the region of the AOSLO imaging. For the control, the averaged TD over three reports (visits) was −0.67 dB at 9° nasal, 3° superior field, and −1 dB at 9° nasal, 3° inferior field. For the patient, the corresponding averaged TD over three reports (visits) was −2.33 dB at 9° nasal, 3° superior field, and −0.33 dB at 9° nasal, 3° inferior field.

