Figure 2.

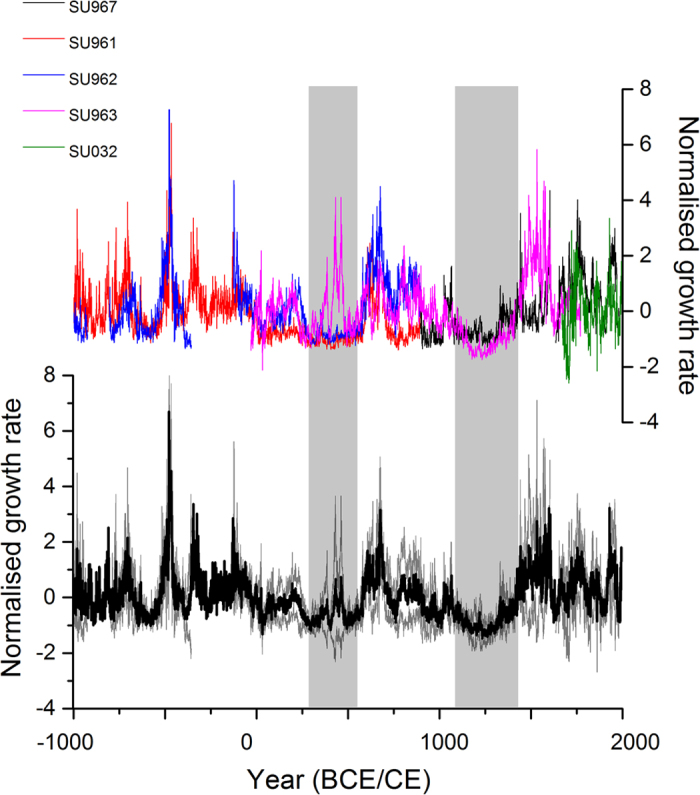
(a) Five standardised stalagmite growth-rate series. (b) Screened SUcomp. Data are shown as mean (black) and 1σ variability (grey). Periods where there are low growth runs are shown by the vertical shading.

(a) Five standardised stalagmite growth-rate series. (b) Screened SUcomp. Data are shown as mean (black) and 1σ variability (grey). Periods where there are low growth runs are shown by the vertical shading.