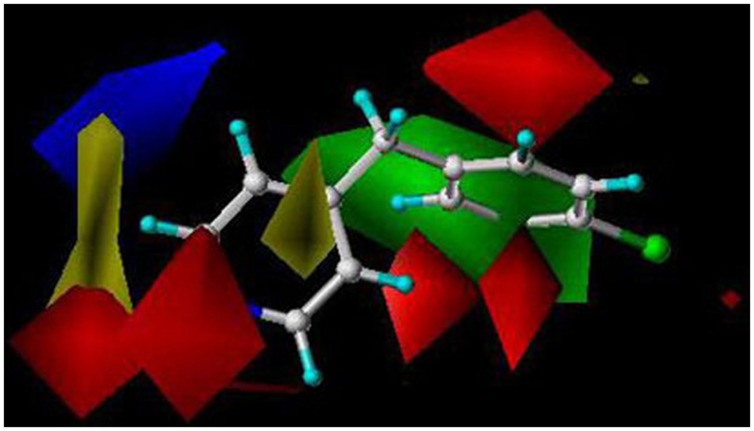
FIGURE 2.
A CYP2B6 CoMFA model created with 41 training set and seven test set compounds. The predictive power of the model was very good (r2 = 0.85). Red and green in the color contour map represent areas where more negative partial charge and bulkier groups increase inhibition potency, respectively. Blue and yellow represent areas where more negative partial charge and bulkier groups decrease inhibition potency, respectively. The reference structure is 4-(4-chlorobenzyl)pyridine. Reproduced with permission from John Wiley & Sons (Korhonen et al., 2007).

